A USD/NOK Case Study in Risk Management
Here you can find all the latest breaking forex and currency news about A USD/NOK Case Study in Risk Management including currency analysis and forecasts, live foreign exchange rates, central bank interest rates, and currency trading strategies from experienced fx traders and forex platforms.
Talking Points:
- Norwegian Data Surprises to the Upside
- Mixed Technical Outlook for USD/NOK
- Why Risk Management Matters
Recent economic data out of Norway has been surprisingly strong, as core inflation climbed to 2.6% year-over-year, which is above the inflation target set forth by Norges Bank. In addition, March housing numbers also surprised to the upside.
The stronger data has boosted investor appetite for the Norwegian krone (NOK), as evidenced by the latest weekly flow report from Norges Bank, which shows that foreign banks (a good proxy for speculative money flow) have added NOK38 billion to net long positions so far in 2014, and have added NOK14 billion in just the last two weeks.
As such, it will be interesting to see how the market reacts in upcoming months when a high number of Norwegian bonds are set to expire, and many companies listed on the Oslo Stock Exchange are set to pay out yearly dividends to investors. The big question seems to be whether investors will take profits or reinvest back into the market.
In a recent publication, we were looking for a comeback (long) in USDNOK from the support area around 5.95-5.90. We did see a decent bounce up to 6.08, but the pair never did reach our first price target of 6.15.
Currently, USDNOK is trading slightly above the year-to-date low around 5.90. However, the next potentially significant move is hard to identify, as the below daily chart doesn’t present much of a clear technical picture, and the fundamentals vary as well.
Guest Commentary: Uncertain Technical Outlook for USD/NOK
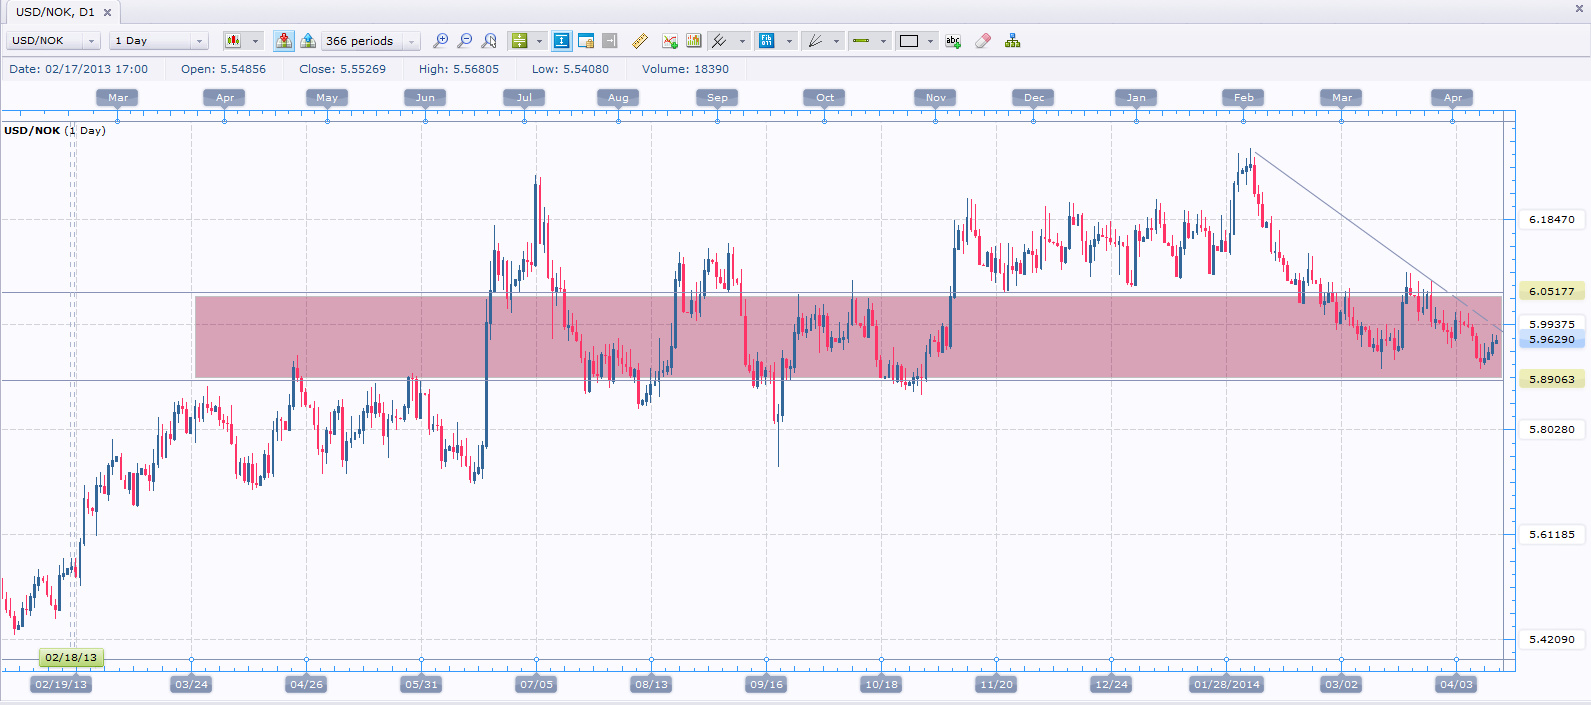
Support: 5.90, 5.85, 5.80, and 5.75
Resistance: 6.05-6.08, 6.15, 6.22, and 6.30
USDNOK should find strong horizontal support around the 5.90 area. However, failure to hold the 5.90 level would signal further downside to 5.85 and then 5.80. To the upside, we strong resistance has been established between 6.05 and 6.08, and as such, a break and hold above 6.08 would be required to suggest further upside to 6.15 and then 6.22.
From a longer-term perspective, the prevailing trend in USDNOK is still to the upside, as higher highs and higher lows are evident on the chart. Still, the recent bounce from 5.90+ was rather weak, and the move up was ultimately sold back down quite fast. This might support a broader horizontal range for USDNOK, but only time will prove or disprove that hypothesis.
Why Risk Management Matters
The uncertain technical and fundamental picture for USDNOK means that there is no clear trade idea at this time, but recent price action does help illustrate once again the critical importance of risk management as part of any investing or trading portfolio.
We recently recommended a long position in USDNOK from the 5.95 area and placed a stop loss in case the pair closed below 5.92 on the daily time frame. The targets for that trade were 6.15 and 6.22, respectively.
In short, the potential upside was a minimum 2000 pips (6.15), while the downside was limited to only 300 pips, which resulted in an overall risk profile of 1:6.7. While 1:2 is considered the minimum acceptable level, some investors won’t commit hard-earned capital to any set-ups that do not have at least 1:4. Of course, each individual must decide what the minimum acceptable risk profile is for their trading.
In this case, we did have a very good overall risk profile for potential long positions in USDNOK, but bear in mind that risk management is a dynamic process and we must always adjust based on current price levels.
Once USDNOK went up to 6.08 following the initial position, remaining upside potential was 700 pips to reach the first price target of 6.15, while potential downside (using the initial stop loss at 5.92) was now 1600 pips. Clearly, the overall risk profile had changed drastically, and at that time, had declined all the way to 2.3:1.
As a result, to stay true to the traditional risk management rules, we should ideally risk no more than half of the potential reward (which was 700 pips). That would be 350 pips of risk, in this case, and that’s why it would be most prudent at that time to move the stop loss from 5.92 to 6.045 in order to maintain a healthy overall risk profile for this trade.
Please note that the 6.08 price point was just used for illustration purposes and to give a clear picture of the risk profile at that point in the trade. As stated earlier, risk management is a dynamic process and should always be recalculated when a currency price is moving in any direction, whether in the trader’s favor or not.
This recent example in USDNOK helps to reinforce several important points about risk management. In trading, it’s not about always being “right” or correctly timing the market. Ultimately, it’s all about sufficiently protecting your portfolio at all times, and ensuring that there’s always a healthy minimum upside compared to the possible downside. Essentially, that is what risk management is all about, and why it’s such a critical skill for traders and investors alike.
By Rafiul Hossain, Guest Contributor, DailyFX.com
original source
The article above is about breaking forex and currency news regarding A USD/NOK Case Study in Risk Management , if you have any question about it. Please contact us by using the link below. Thanks for your patience.
- Japanese Yen Gains, Nikkei Falls as BOJ Leaves Policy Unchanged
- Chinese Business Sentiment Contracts for the First Time in 4 Months
- Dismal UK Retail Sales to Spur Another Test of GBP/USD Resilience
- Forex-Webinar:-FOMC-Minutes-Reinforce-Hike-Forecast
- Trading Video: Dollar Fails to Rally on Hawkish FOMC, Equities Rally
- Among Top Themes, Where is the Risk Most Potent: Fed Hike, China, EM?
- EUR/USD Technical Analysis: Looking to Short on Bounce
- US Dollar Declines as FOMC Minutes Bring Nothing New to the Table
- US DOLLAR Technical Analysis: USD Holds Support on FOMC Minutes
- WTI Crude Oil Price Forecast: What Now That $40bbl Broke?
- Fingertrp Scalping with James Stanley (Using Tradingview Charts)
- EUR/USD Risks Fresh Monthly Lows on Hawkish FOMC Minutes
- Analyst Pick - Kiwi & CAD in Focus
- Price & Time: USD/CAD ? It?s Showtime
- GBP/USD Ranges Ahead of FOMC Minutes
- President Xi Warns That China Faces Considerable Downward Pressure
- FOMC Minutes Later Today - USD Set for October 28 Redux
- Silver Price Is Targeting Its Yearly Low
- FTSE 100: Commodity Markets Wants to See The FTSE 100 at 6040
- DAX 30: Momentum Slows Down, FOMC Minutes on Tap
- US Dollar May Extend Gains as Fed Minutes Foreshadow Rate Hike
- Copper Surplus Faces Falling Premiums; Gold Slides before Fed Minutes
- China Real Estate Market Recovery Slows in October
- Traders Not as Confident of Fed Hike as Markets, Economists
- EUR/GBP Technical Analysis: Euro Drops to 3-Month Low
- Dollar Unmoved After China Treasury Holdings Hit a 7 Month Low
- Can Dollar Climb Continue After FOMC Forecast Shift?
- Dollar’s CPI Rally Lacking, Stall in Risk Raises Yen Crosses Appeal
- NZD/USD Technical Analysis: Short Trade Activated Sub-0.65
- Will the DAX Crack or Cower from Resistance?