Trading a Rare Diamond Pattern in NZD/CHF
Here you can find all the latest breaking forex and currency news about Trading a Rare Diamond Pattern in NZD/CHF including currency analysis and forecasts, live foreign exchange rates, central bank interest rates, and currency trading strategies from experienced fx traders and forex platforms.
Talking Points:
- Unusual Diamond Pattern in NZD/CHF
- Range-Bound Price Action on Smaller Time Frames
- 2 Important Points About Risk Profile
Both the New Zealand dollar (NZD) and Swiss franc (CHF) are more traditionally associated with gold than with diamonds, but there is an extremely unusual diamond pattern occurring on the below weekly chart of NZDCHF right now.
Guest Commentary: Diamond Pattern on NZD/CHF Weekly Chart
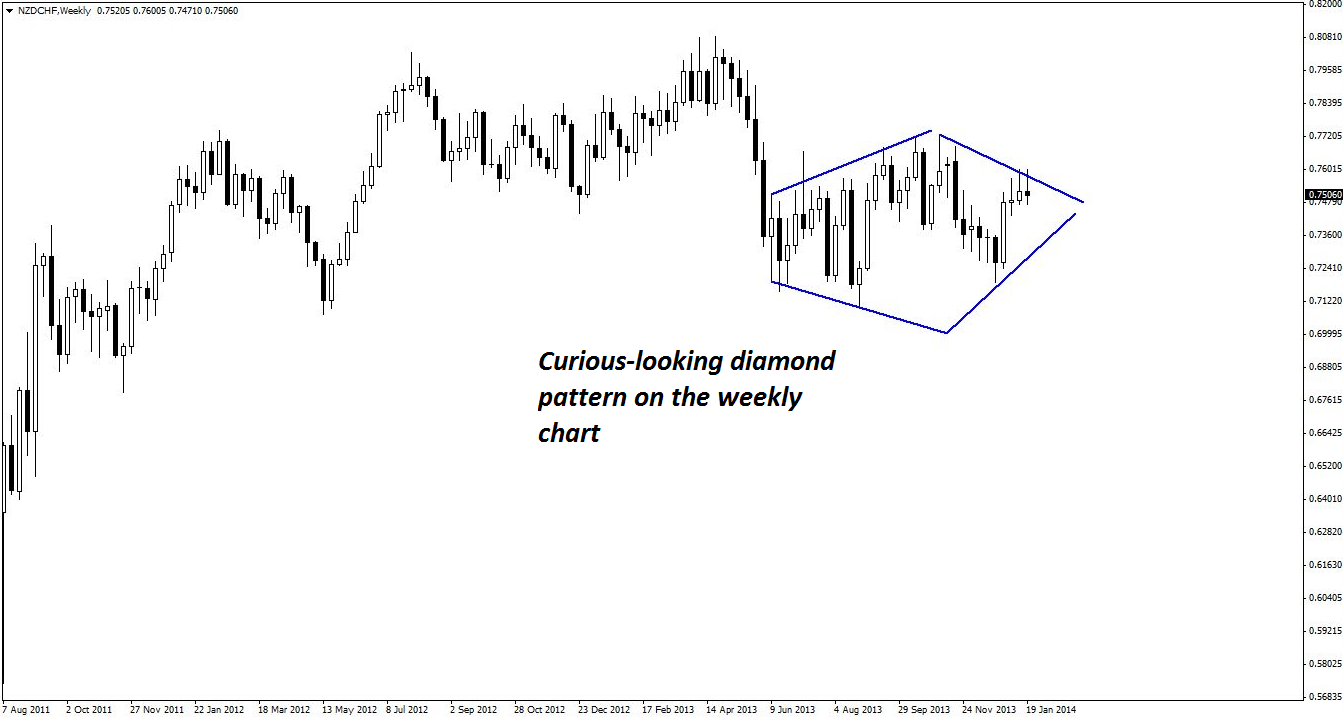
Exotic as it may sound, the diamond pattern is essentially a special type of consolidation. The expected movement is down, especially in this case considering the previous downside momentum. However, given that NZDCHF shows no danger of breaking down on the weekly chart (and could unexpectedly shoot up), the focus should be on the lower time frames and any opportunities presented therein.
The daily chart below provides an interesting perspective in that a rising trend line is supporting price as it challenges the weekly diamond pattern. Currently, price has pulled back to support and neither bulls nor bears are showing a stronger hand.
Guest Commentary: Range-Bound Daily Price Action in NZD/CHF

The best solution, then, is to assume that some form of range pattern will prevail. There has already been previous horizontal support, and when considered in conjunction with the rising trend line, it allows for a long trade that has at least 80-100 pips to move. That may not seem like much, but if risk can be controlled tightly enough, then it will be enough to justify taking the trade.
The four-hour chart below shows a slightly different situation. Here, the trend line has already been overshot, and thus, the trade should be focused on the expected retest of that trend line.
Guest Commentary: Trend-Line Retest on 4-Hour Chart of NZD/CHF

Horizontal support levels are readily available using previous price action, and a confluence of at least three of these levels provides a nicely defined support zone of 0.7459-0.7487.
Price is just beginning to touch the support zone, but there’s still time before this set-up triggers on the hourly chart (not shown). The triggers in play would be bullish reversal divergence, pin bars, and/or bullish engulfing candlestick patterns.
The upside to the trend-line retest zone is only about 25 pips, and while this might seem too small given a support zone that is 28 pips deep, traders are reminded of two factors:
- Once the trigger occurs, stop losses may be placed below the low of the pattern involved, which may be much less than 28 pips; and…
- This trade, and indeed all trades, are mainly aimed at getting the trader into a high-probability interaction with the market so that a position can be protected quickly. If this move develops and the trend-line breakout turns out to be false, price could run the 80-100 pips discussed at the beginning of the article, and potentially even more if it breaks the diamond pattern.
Ultimately, no one has the proverbial crystal ball, and thus the job of the trader is to keep taking the next trade and be well-positioned if/when that sizable move develops.
By Kaye Lee, private fund trader and head trader consultant, StraightTalkTrading.com
original source
The article above is about breaking forex and currency news regarding Trading a Rare Diamond Pattern in NZD/CHF, if you have any question about it. Please contact us by using the link below. Thanks for your patience.
- Japanese Yen Gains, Nikkei Falls as BOJ Leaves Policy Unchanged
- Chinese Business Sentiment Contracts for the First Time in 4 Months
- Dismal UK Retail Sales to Spur Another Test of GBP/USD Resilience
- Forex-Webinar:-FOMC-Minutes-Reinforce-Hike-Forecast
- Trading Video: Dollar Fails to Rally on Hawkish FOMC, Equities Rally
- Among Top Themes, Where is the Risk Most Potent: Fed Hike, China, EM?
- EUR/USD Technical Analysis: Looking to Short on Bounce
- US Dollar Declines as FOMC Minutes Bring Nothing New to the Table
- US DOLLAR Technical Analysis: USD Holds Support on FOMC Minutes
- WTI Crude Oil Price Forecast: What Now That $40bbl Broke?
- Fingertrp Scalping with James Stanley (Using Tradingview Charts)
- EUR/USD Risks Fresh Monthly Lows on Hawkish FOMC Minutes
- Analyst Pick - Kiwi & CAD in Focus
- Price & Time: USD/CAD ? It?s Showtime
- GBP/USD Ranges Ahead of FOMC Minutes
- President Xi Warns That China Faces Considerable Downward Pressure
- FOMC Minutes Later Today - USD Set for October 28 Redux
- Silver Price Is Targeting Its Yearly Low
- FTSE 100: Commodity Markets Wants to See The FTSE 100 at 6040
- DAX 30: Momentum Slows Down, FOMC Minutes on Tap
- US Dollar May Extend Gains as Fed Minutes Foreshadow Rate Hike
- Copper Surplus Faces Falling Premiums; Gold Slides before Fed Minutes
- China Real Estate Market Recovery Slows in October
- Traders Not as Confident of Fed Hike as Markets, Economists
- EUR/GBP Technical Analysis: Euro Drops to 3-Month Low
- Dollar Unmoved After China Treasury Holdings Hit a 7 Month Low
- Can Dollar Climb Continue After FOMC Forecast Shift?
- Dollar’s CPI Rally Lacking, Stall in Risk Raises Yen Crosses Appeal
- NZD/USD Technical Analysis: Short Trade Activated Sub-0.65
- Will the DAX Crack or Cower from Resistance?