Two Triangles, One AUD/JPY Trade
Here you can find all the latest breaking forex and currency news about Two Triangles, One AUD/JPY Trade including currency analysis and forecasts, live foreign exchange rates, central bank interest rates, and currency trading strategies from experienced fx traders and forex platforms.
Talking Points:
- Triangle Consolidation on AUD/JPY Weekly Chart
- The Triangle within a Triangle on Daily Chart
- Risk-Controlled Long Set-up from Strong Support
AUDJPY likely has many intraday traders spooked after its recent run to the down side. However, a look at the bigger picture offers a more interesting possibility where the pair may put in at least a short-term low in the near future.
Although the weekly chart below does not currently offer much in terms of trend direction that is relevant to intraday trades, it at least reveals a longer-term triangle consolidation area.
Guest Commentary: Triangle Consolidation on AUD/JPY Weekly Chart

Thus, on the daily chart, more choppiness can be expected, but this also lends credence to the notion of applying a range-type strategy to engage with price.
The daily chart below sports a smaller triangle within the larger one. Price has just broken the support of this daily triangle and now looks poised to head further down. However, before it does, it is reasonable to expect a retest of the trend line resistance.
Guest Commentary: Triangle within a Triangle for AUD/JPY
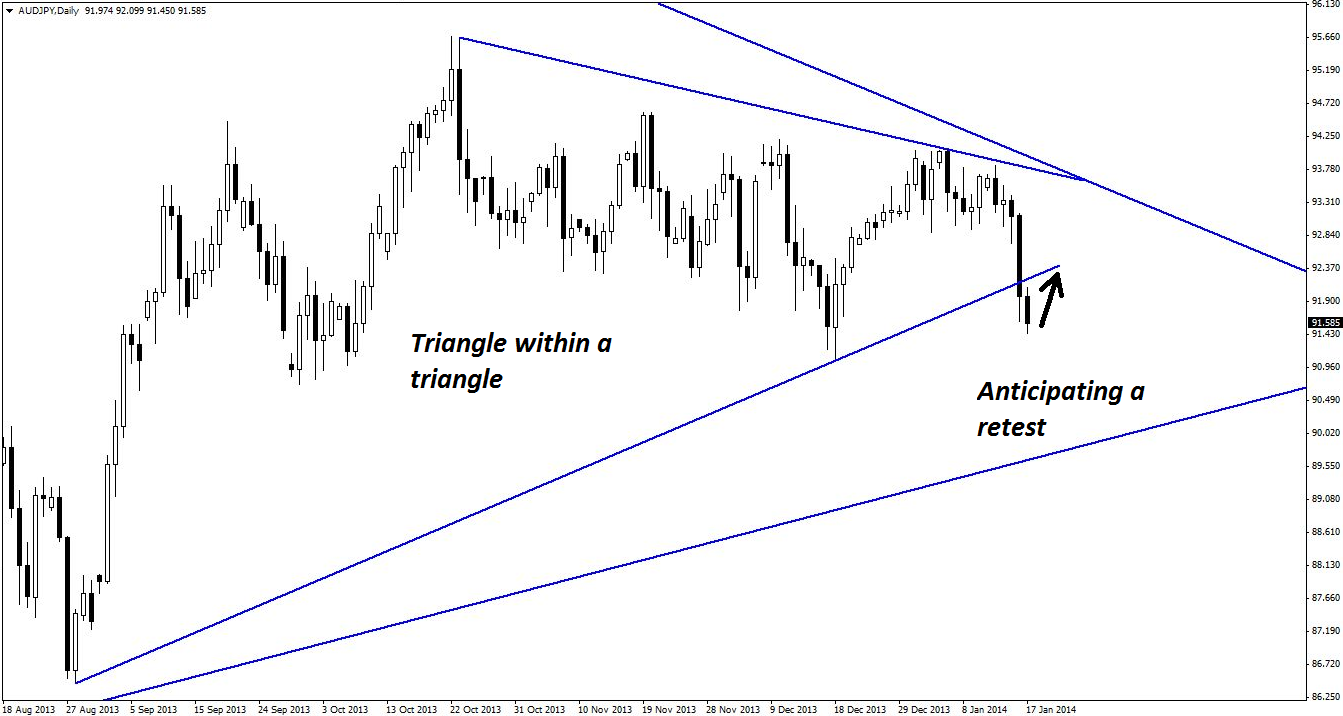
Although this may look small, it represents an 80-pip move. And, if the breakout turns out to be false, there are 200 pips until next resistance. Although those numbers make trading this on the daily chart unattractive, an intraday set-up would likely prove adequate.
The normal procedure would be to head down to a lower time frame to identify support or resistance, but in this case, the horizontal levels actually stretch far enough back that they are more clearly visible when zooming out on the daily chart, as shown below.
Guest Commentary: Previous Support/Resistance for AUD/JPY
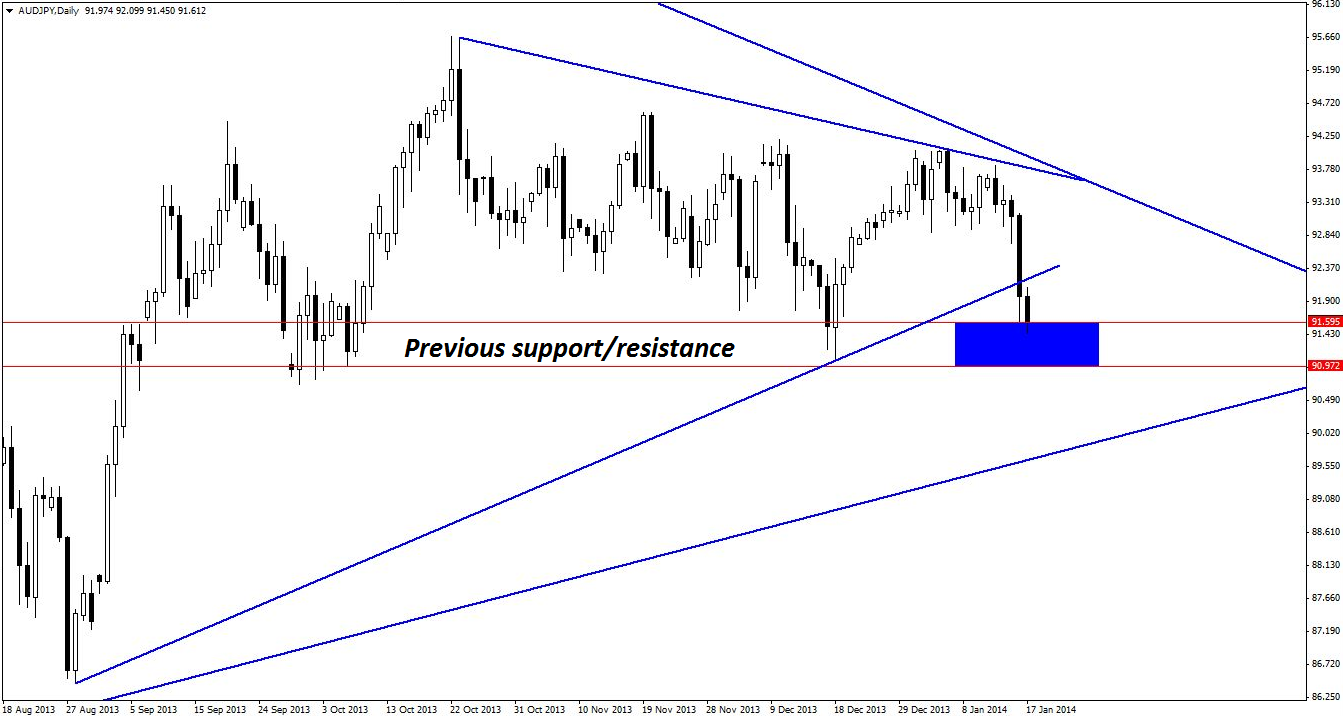
Analysis suggests that the best area of support is 90.97-91.59. This zone represents an approximate 62 pips of risk, which makes the trade more attractive from an overall risk/reward standpoint.
The four-hour chart below shows the strong recent down move that likely scared many buyers out of the market. Due to the extreme momentum and lack of evidence of strong buying, this represents a considerable risk to those using it to trigger an entry. Instead, it would be wiser to either, 1) enter earlier, before four-hourly buyers take action; or 2) enter later, after a genuine move up has been confirmed.
Guest Commentary: Strong Intraday Down Move in AUD/JPY

For the purposes of intraday trading, the earlier entry presents a more valid option, as it allows for nimble trade management and scaling out if conditions prove unfavorable. It may take two or three tries to get this trade right, but the prize for those who are successful will be an early entry.
Thus, the hourly chart is the viable entry time frame, and bullish reversal divergence, bullish pin bars, and/or bullish engulfing patterns will be viable trade triggers.
With luck, this will prove to be a false breakout of the daily triangle, and price will then reverse quickly to the upside. If it doesn’t, however, there will be another trade if/when price does retest the underside of the triangle from which it has just broken out.
By Kaye Lee, private fund trader and head trader consultant, StraightTalkTrading.com
original source
The article above is about breaking forex and currency news regarding Two Triangles, One AUD/JPY Trade, if you have any question about it. Please contact us by using the link below. Thanks for your patience.
- Japanese Yen Gains, Nikkei Falls as BOJ Leaves Policy Unchanged
- Chinese Business Sentiment Contracts for the First Time in 4 Months
- Dismal UK Retail Sales to Spur Another Test of GBP/USD Resilience
- Forex-Webinar:-FOMC-Minutes-Reinforce-Hike-Forecast
- Trading Video: Dollar Fails to Rally on Hawkish FOMC, Equities Rally
- Among Top Themes, Where is the Risk Most Potent: Fed Hike, China, EM?
- EUR/USD Technical Analysis: Looking to Short on Bounce
- US Dollar Declines as FOMC Minutes Bring Nothing New to the Table
- US DOLLAR Technical Analysis: USD Holds Support on FOMC Minutes
- WTI Crude Oil Price Forecast: What Now That $40bbl Broke?
- Fingertrp Scalping with James Stanley (Using Tradingview Charts)
- EUR/USD Risks Fresh Monthly Lows on Hawkish FOMC Minutes
- Analyst Pick - Kiwi & CAD in Focus
- Price & Time: USD/CAD ? It?s Showtime
- GBP/USD Ranges Ahead of FOMC Minutes
- President Xi Warns That China Faces Considerable Downward Pressure
- FOMC Minutes Later Today - USD Set for October 28 Redux
- Silver Price Is Targeting Its Yearly Low
- FTSE 100: Commodity Markets Wants to See The FTSE 100 at 6040
- DAX 30: Momentum Slows Down, FOMC Minutes on Tap
- US Dollar May Extend Gains as Fed Minutes Foreshadow Rate Hike
- Copper Surplus Faces Falling Premiums; Gold Slides before Fed Minutes
- China Real Estate Market Recovery Slows in October
- Traders Not as Confident of Fed Hike as Markets, Economists
- EUR/GBP Technical Analysis: Euro Drops to 3-Month Low
- Dollar Unmoved After China Treasury Holdings Hit a 7 Month Low
- Can Dollar Climb Continue After FOMC Forecast Shift?
- Dollar’s CPI Rally Lacking, Stall in Risk Raises Yen Crosses Appeal
- NZD/USD Technical Analysis: Short Trade Activated Sub-0.65
- Will the DAX Crack or Cower from Resistance?